


Pt1000 table
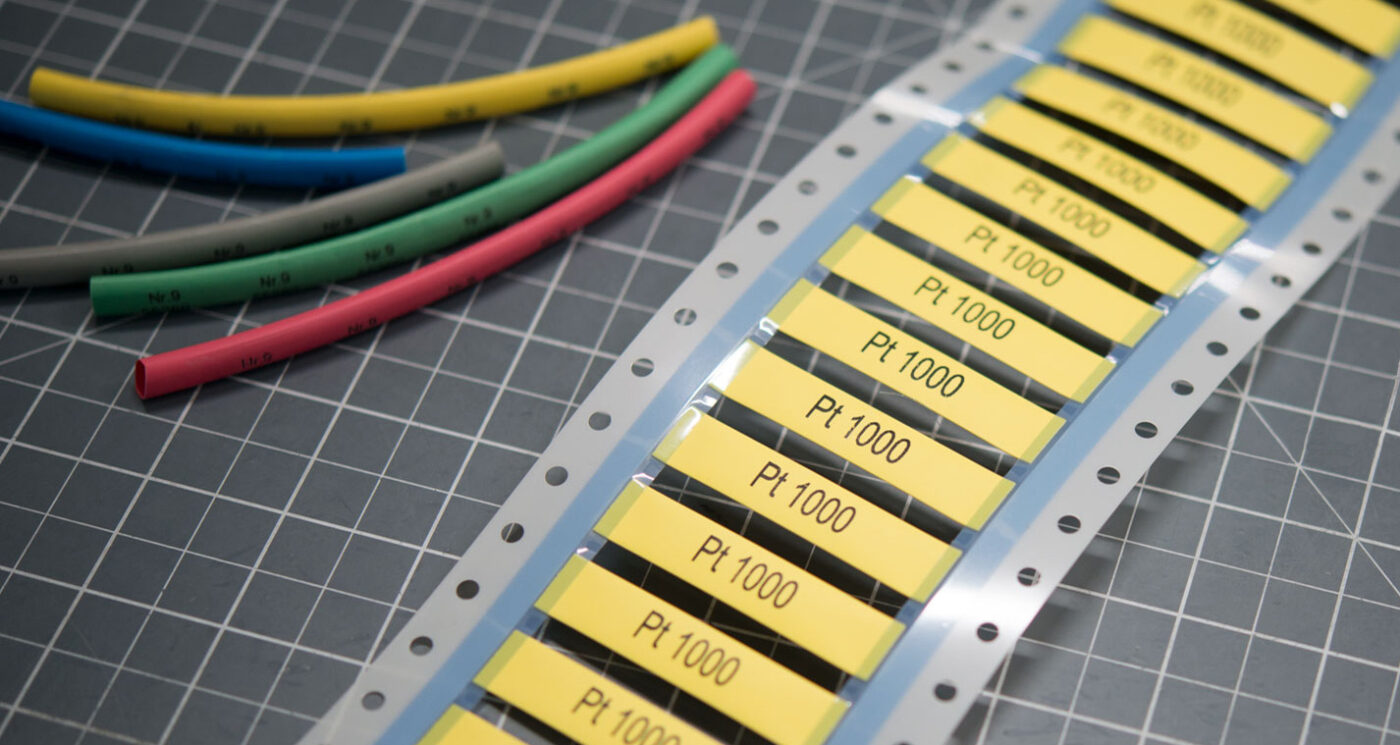
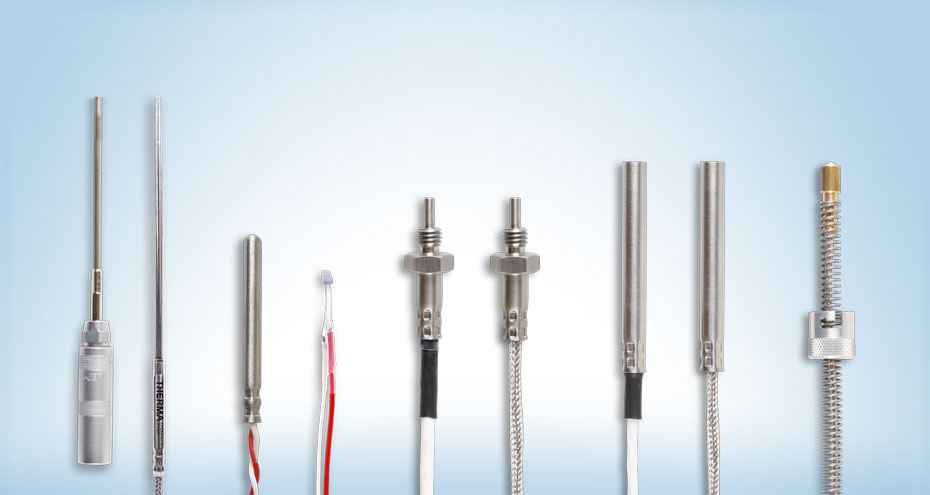
Pt1000 table for every probe from our own production
The Pt1000 table gives you the matching resistance value for every temperature to DIN EN 60751. A Pt1000 reads exactly 1000 ohms at 0 °C, a Pt100 at the same point reads 100 ohms. That factor of ten holds across the entire measuring range. The shape of the characteristic curve stays the same.
We have manufactured resistance thermometers in Lindlar since 1991, every sensor by hand and to ISO 9001. Because the same standard governs our test equipment, the Pt1000 temperature sensor resistance table matches our final inspection exactly. Our resistance thermometers are mostly available from stock, with a standard delivery time of one week.
Custom designs follow within one to two weeks, built to drawing or STEP file. A special design changes nothing in the Pt1000 table, because base resistance and temperature coefficient are standardised. Deviations arise solely from the tolerance class of the measuring resistor fitted. Whether a wire-wound or a thin-film platinum element does the work affects long-term stability and the upper operating limit, not the nominal values.
The measuring range in the Pt1000 temperature table runs to 850 degrees Celsius
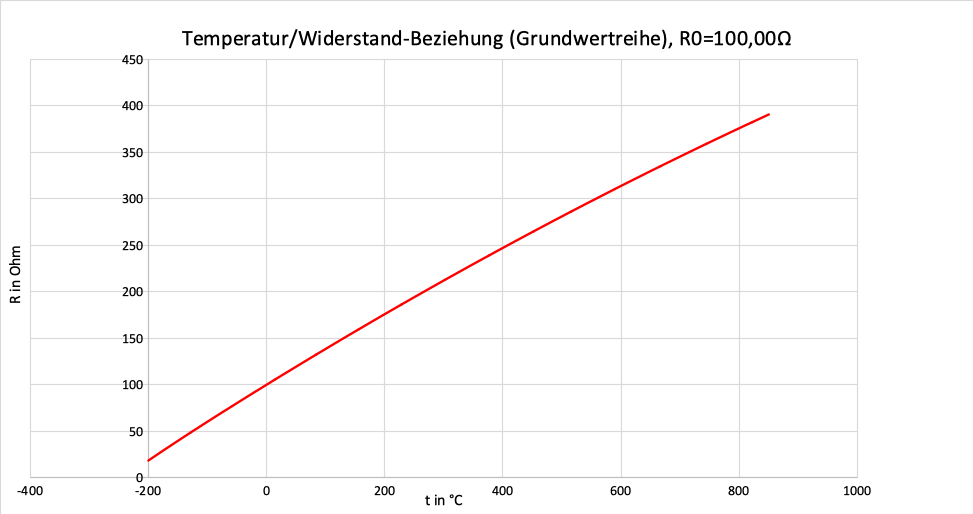
Standardised values start at minus 200 °C with 185.2 ohms and end at 850 °C with 3904.8 ohms. Between those two points the Pt1000 curve bends slightly instead of running straight. Close to 0 °C the resistance changes by around 3.85 ohms per kelvin, at 800 °C by only about 3.1 ohms.
That curvature is described by the Callendar-Van-Dusen equation with the constants A = 3.9083 x 10⁻³ and B = minus 5.775 x 10⁻⁷. For everyday work, a glance at the Pt1000 resistance chart is enough. The Pt1000 temperature table below shows the progression across the full measuring range, next to it the Pt100 values and the permissible deviation of class B.
| Temperature | Pt1000 in ohms | Pt100 in ohms | Tolerance class B |
|---|---|---|---|
| minus 200 °C | 185.2 | 18.52 | ±1.3 K |
| minus 100 °C | 602.6 | 60.26 | ±0.8 K |
| 0 °C | 1000.0 | 100.00 | ±0.3 K |
| 100 °C | 1385.1 | 138.51 | ±0.8 K |
| 300 °C | 2120.5 | 212.05 | ±1.8 K |
| 500 °C | 2809.8 | 280.98 | ±2.8 K |
| 850 °C | 3904.8 | 390.48 | ±4.55 K |
How strongly the characteristic curve bends shows in the gaps between the reference points. From 0 °C to 100 °C the resistance rises by 385.1 ohms, from 500 °C to 600 °C by only 327.3 ohms. Anyone comparing a Pt1000 RTD resistance chart from different suppliers will find identical figures, because the standard fixes every nominal value.
Our complete Pt1000 resistance table maps the progression in 1 kelvin steps. Between two neighbouring reference points, linear interpolation is enough and the curvature error stays below 0.001 K. If you measure to tight tolerances, work with the curve equation rather than a fixed factor.
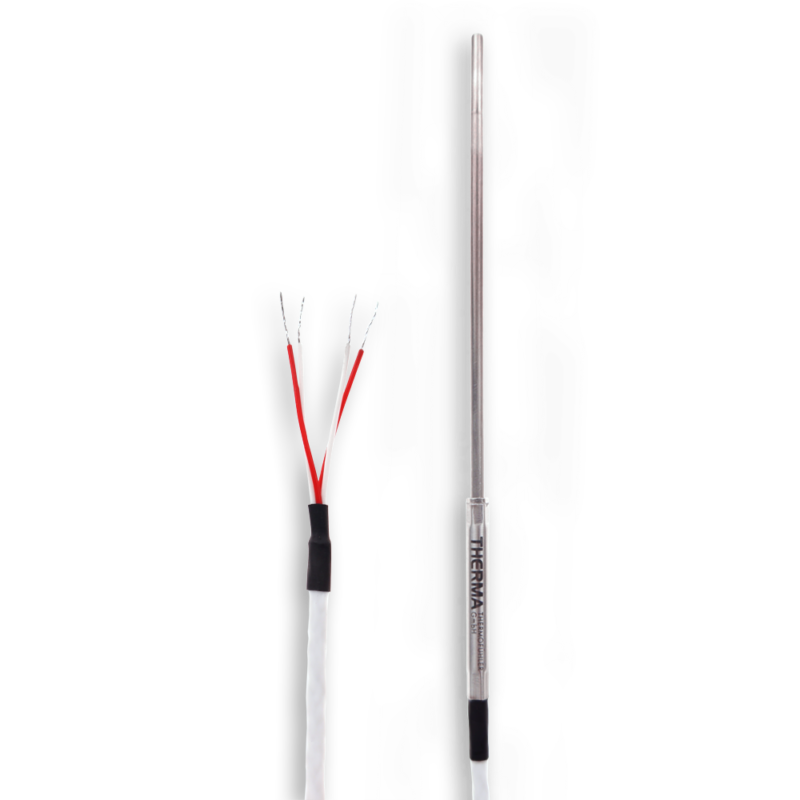
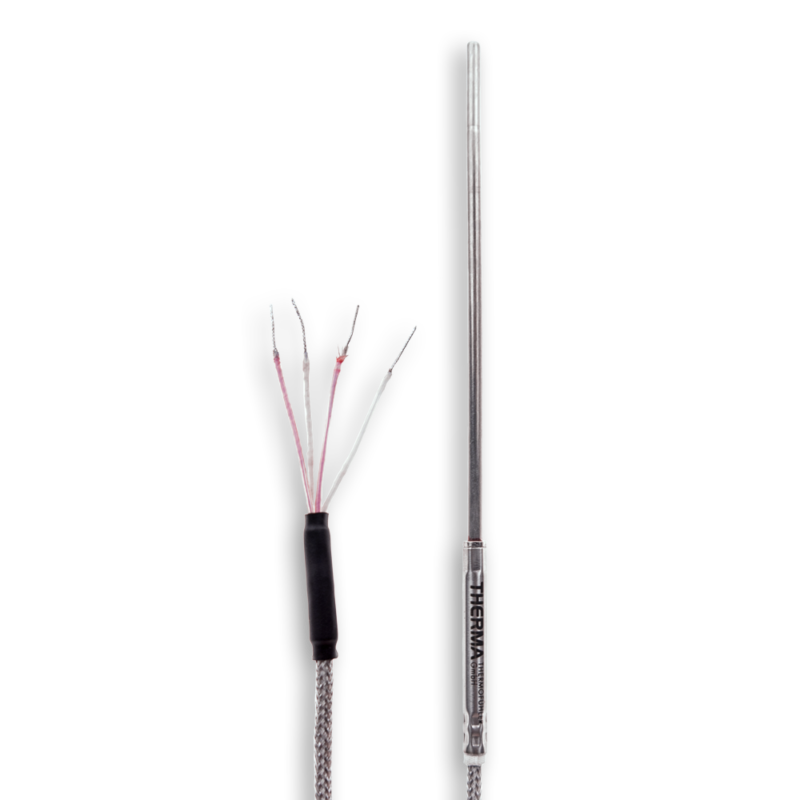

Temperature/resistance relationship table PT 100 & 1000
| t [°C] | R0=100 [Ω] | R0=1000 [Ω] |
| -200 | 18,5 | 185,2 |
| -150 | 39,7 | 397,2 |
| -100 | 60,3 | 602,6 |
| -50 | 80,3 | 803,1 |
| 0 | 100,0 | 1000,0 |
| 100 | 138,5 | 1385,1 |
| 200 | 175,9 | 1758,6 |
| 300 | 212,1 | 2120,5 |
| 400 | 247,1 | 2470,9 |
| 500 | 281,0 | 2809,8 |
| 600 | 313,7 | 3137,1 |
| 700 | 345,3 | 3452,8 |
| 800 | 375,7 | 3757,0 |
| 850 | 390,5 | 3904,8 |
| t [°C] | R0=100 [Ω] | R0=1000 [Ω] |
| -200 | 18,5 | 185,2 |
| -190 | 22,8 | 228,3 |
| -180 | 27,1 | 271,0 |
| -170 | 31,3 | 313,4 |
| -160 | 35,5 | 355,4 |
| -150 | 39,7 | 397,2 |
| -140 | 43,9 | 438,8 |
| -130 | 48,0 | 480,0 |
| -120 | 52,1 | 521,1 |
| -110 | 56,2 | 561,9 |
| -100 | 60,3 | 602,6 |
| -90 | 64,3 | 643,0 |
| -80 | 68,3 | 683,3 |
| -70 | 72,3 | 723,3 |
| -60 | 76,3 | 763,3 |
| -50 | 80,3 | 803,1 |
| -40 | 84,3 | 842,7 |
| -30 | 88,2 | 882,2 |
| -20 | 92,2 | 921,6 |
| -10 | 96,1 | 960,9 |
| 0 | 100,0 | 1000,0 |
| 10 | 103,9 | 1039,0 |
| 20 | 107,8 | 1077,9 |
| 30 | 111,7 | 1116,7 |
| 40 | 115,5 | 1155,4 |
| 50 | 119,4 | 1194,0 |
| 60 | 123,2 | 1232,4 |
| 70 | 127,1 | 1270,8 |
| 80 | 130,9 | 1309,0 |
| 90 | 134,7 | 1347,1 |
| 100 | 138,5 | 1385,1 |
| 110 | 142,3 | 1422,9 |
| 120 | 146,1 | 1460,7 |
| 130 | 149,8 | 1498,3 |
| 140 | 153,6 | 1535,8 |
| 150 | 157,3 | 1573,3 |
| 160 | 161,1 | 1610,5 |
| 170 | 164,8 | 1647,7 |
| 180 | 168,5 | 1684,8 |
| 190 | 172,2 | 1721,7 |
| 200 | 175,9 | 1758,6 |
| 210 | 179,5 | 1795,3 |
| 220 | 183,2 | 1831,9 |
| 230 | 186,8 | 1868,4 |
| 240 | 190,5 | 1904,7 |
| 250 | 194,1 | 1941,0 |
| 260 | 197,7 | 1977,1 |
| 270 | 201,3 | 2013,1 |
| 280 | 204,9 | 2049,0 |
| 290 | 208,5 | 2084,8 |
| 300 | 212,1 | 2120,5 |
| 310 | 215,6 | 2156,1 |
| 320 | 219,2 | 2191,5 |
| 330 | 222,7 | 2226,8 |
| 340 | 226,2 | 2262,1 |
| 350 | 229,7 | 2297,2 |
| 360 | 233,2 | 2332,1 |
| 370 | 236,7 | 2367,0 |
| 380 | 240,2 | 2401,8 |
| 390 | 243,6 | 2436,4 |
| 400 | 247,1 | 2470,9 |
| 410 | 250,5 | 2505,3 |
| 420 | 254,0 | 2539,6 |
| 430 | 257,4 | 2573,8 |
| 440 | 260,8 | 2607,8 |
| 450 | 264,2 | 2641,8 |
| 460 | 267,6 | 2675,6 |
| 470 | 270,9 | 2709,3 |
| 480 | 274,3 | 2742,9 |
| 490 | 277,6 | 2776,4 |
| 500 | 281,0 | 2809,8 |
| 510 | 284,3 | 2843,0 |
| 520 | 287,6 | 2876,2 |
| 530 | 290,9 | 2909,2 |
| 540 | 294,2 | 2942,1 |
| 550 | 297,5 | 2974,9 |
| 560 | 300,8 | 3007,5 |
| 570 | 304,0 | 3040,1 |
| 580 | 307,3 | 3072,5 |
| 590 | 310,5 | 3104,9 |
| 600 | 313,7 | 3137,1 |
| 610 | 316,9 | 3169,2 |
| 620 | 320,1 | 3201,2 |
| 630 | 323,3 | 3233,0 |
| 640 | 326,5 | 3264,8 |
| 650 | 329,6 | 3296,4 |
| 660 | 332,8 | 3327,9 |
| 670 | 335,9 | 3359,3 |
| 680 | 339,1 | 3390,6 |
| 690 | 342,2 | 3421,8 |
| 700 | 345,3 | 3452,8 |
| 710 | 348,4 | 3483,8 |
| 720 | 351,5 | 3514,6 |
| 730 | 354,5 | 3545,3 |
| 740 | 357,6 | 3575,9 |
| 750 | 360,6 | 3606,4 |
| 760 | 363,7 | 3636,7 |
| 770 | 366,7 | 3667,0 |
| 780 | 369,7 | 3697,1 |
| 790 | 372,7 | 3727,1 |
| 800 | 375,7 | 3757,0 |
| 810 | 378,7 | 3786,8 |
| 820 | 381,7 | 3816,5 |
| 830 | 384,6 | 3846,0 |
| 840 | 387,6 | 3875,5 |
| 850 | 390,5 | 3904,8 |

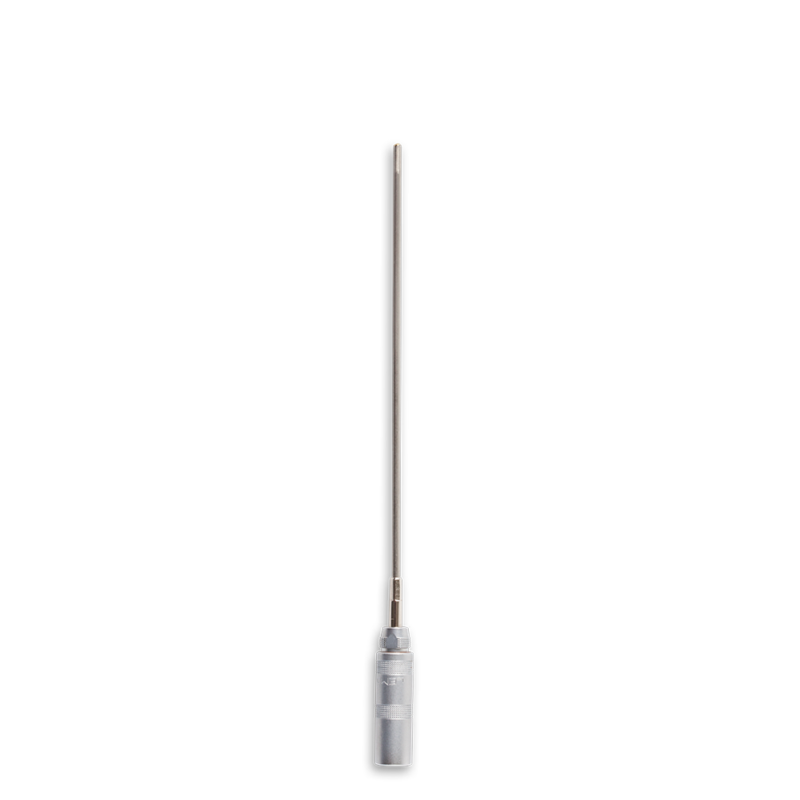
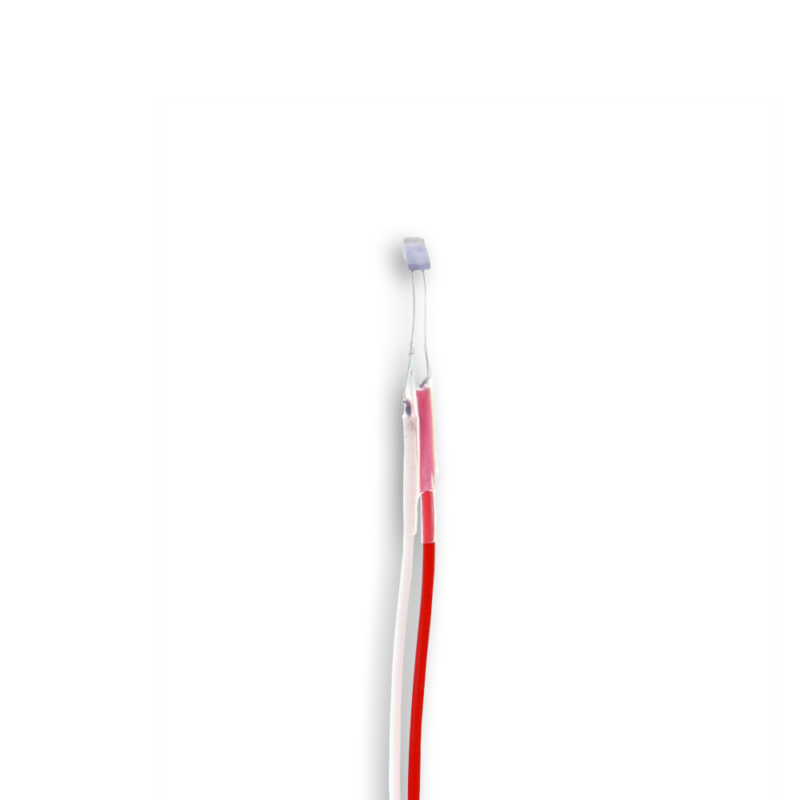
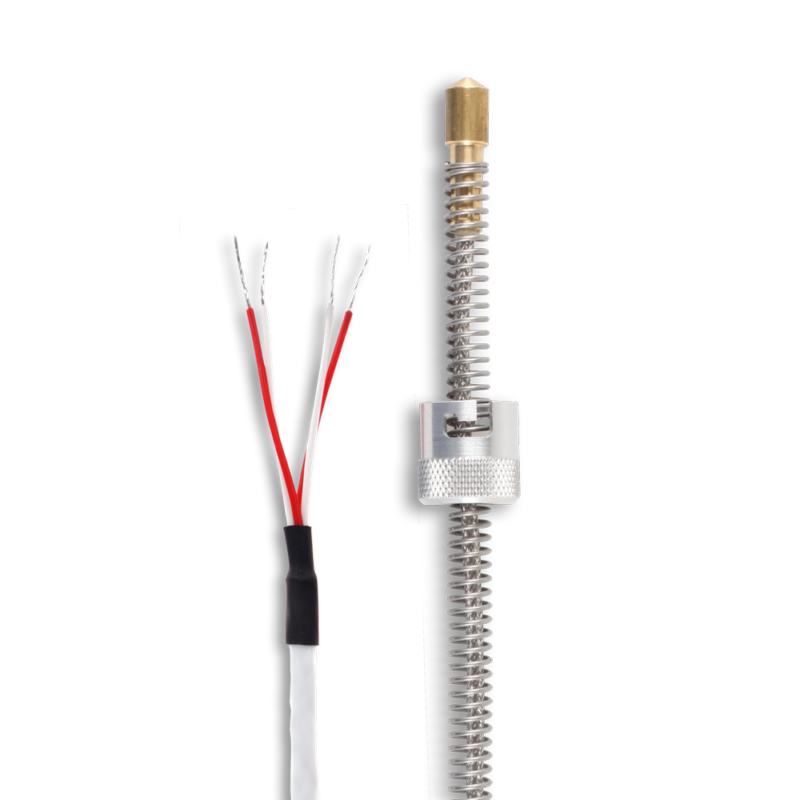
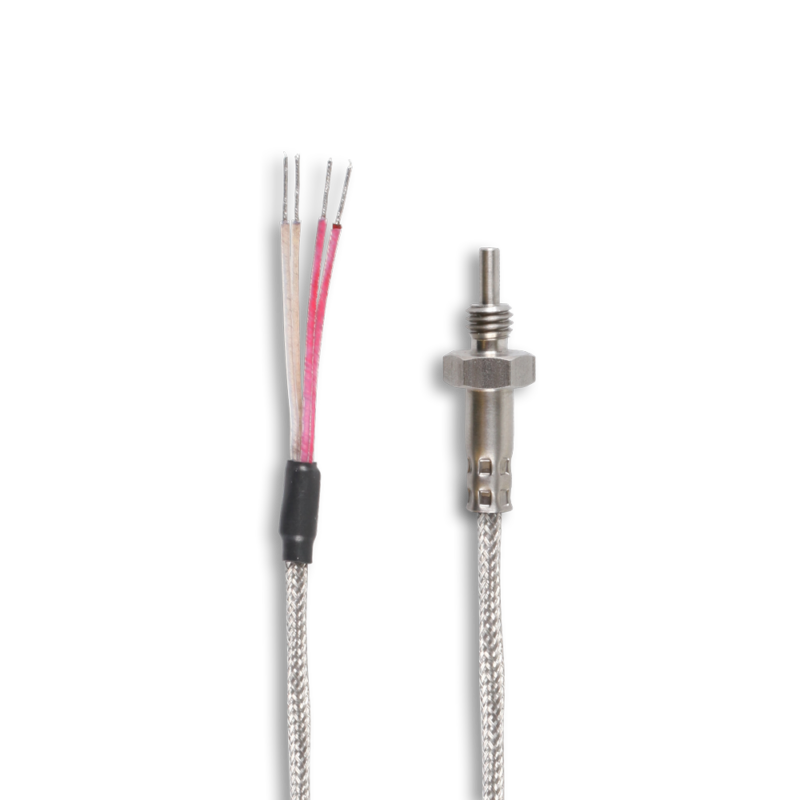
Cable lug RTD | Teflon | Pt1000
22,78 € Sheathing | Fibreglass | Pt1000
68,25 € Sheathing tube | Teflon | Pt1000
22,10 €
Screw-in RTD | Teflon | Pt1000
34,15 € 
Other resistance thermometers
Tolerance classes to DIN EN 60751 and their effect on the values
Every row of the Pt1000 table names a nominal value that a real probe reaches within a defined tolerance. DIN EN 60751 defines four classes for this purpose. Class AA allows ±(0.1 + 0.0017 x |t|) kelvin, class A ±(0.15 + 0.002 x |t|), class B ±(0.3 + 0.005 x |t|) and class C twice the value of class B.
At 100 °C, class B means a permissible deviation of 0.8 K, which converts to just under 3.1 ohms on the Pt1000. A test specimen therefore reaches the figures of the Pt1000 sensor resistance table only within its own class. Class A is tighter. At 0 °C it narrows the limit to ±0.15 K, equivalent to 0.58 ohms, and wire-wound elements carry class AA only from minus 50 to 250 °C.
Traceable values come from calibration alone. Our factory calibration covers minus 30 to 650 °C, and a DAkkS calibration to DIN EN ISO/IEC 17025 is available on request. The test report states the actual deviation at every test point and adds your specific readings to the Pt1000 ohm table.
Pt100 or Pt1000 for your measuring task in plant engineering?
The tenfold base resistance makes the real difference. With a Pt1000, the resistance of the supply line barely registers, which is why a 2 wire circuit is often enough. Take a 10 m copper cable with a cross-section of 0.22 mm², worth around 1.6 ohms. On the Pt100 that means roughly 4.1 K of measuring error, on the Pt1000 only 0.41 K of it remains. Our page on Pt100 wiring shows why a Pt100 needs the 3 wire or 4 wire circuit over long distances.
Self-heating speaks against the Pt1000, because at the same measuring current it dissipates ten times the power. Typical measuring currents are therefore 0.1 to 0.3 mA instead of 1 mA. In plant engineering the Pt100 remains the industry standard. Battery-powered devices and long cable runs are where the Pt1000 plays to its strengths. For both sensor types, the Pt1000 table answers the question in one place, because the Pt100 column runs alongside it.
When it comes to the design, the Pt1000 RTD table is of no help, because it describes the platinum element alone. Insertion length, process connection and medium decide which sensor fits. Our Pt1000 temperature sensors are built in all common versions, from the screw-in design to the surface sensor. Does that change the nominal values? No, the Pt1000 table applies to every design unchanged.
Download the Pt1000 table PDF for workshop and test laboratory
At the control cabinet, a printed Pt1000 temperature chart helps more than any web page. A laminated Pt1000 table next to the terminal strip survives more workshop days than a browser tab. Download the Pt1000 table PDF with all values in 1 kelvin steps. The download is available without registration. Many procurement systems file it as an RTD Pt1000 resistance table PDF. North American data sheets list the same reference points as a 1000 Ohm platinum RTD chart, so the figures transfer directly.
Those same figures are available as a Pt1000 table Excel file, extended by columns for the limit deviation of classes A and B. Recurring tests are documented this way without manual retyping. You enter your measured values right next to them.
Intermediate values and the back-calculation from ohms to temperature are handled by our Pt1000 calculator. If it is about selecting a probe or a custom design, you can reach our team in Lindlar by phone and by email. We advise you personally before you order.
