


Pt100 table
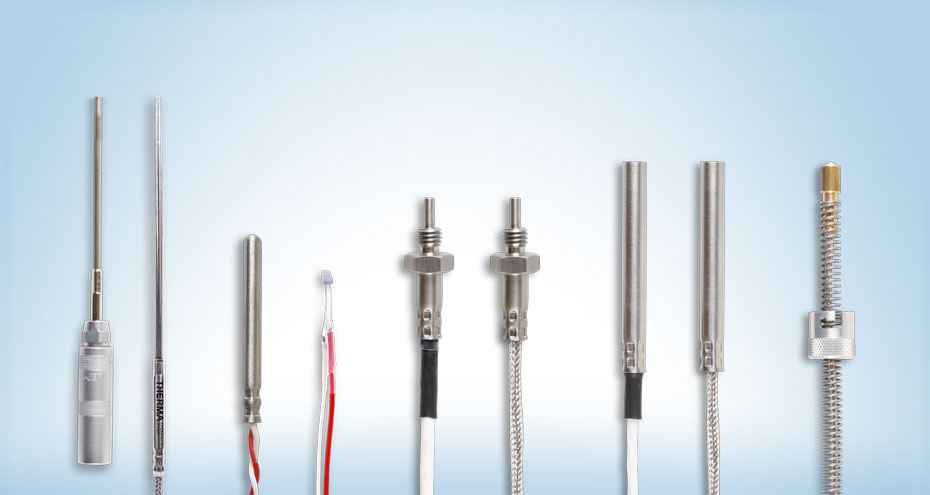
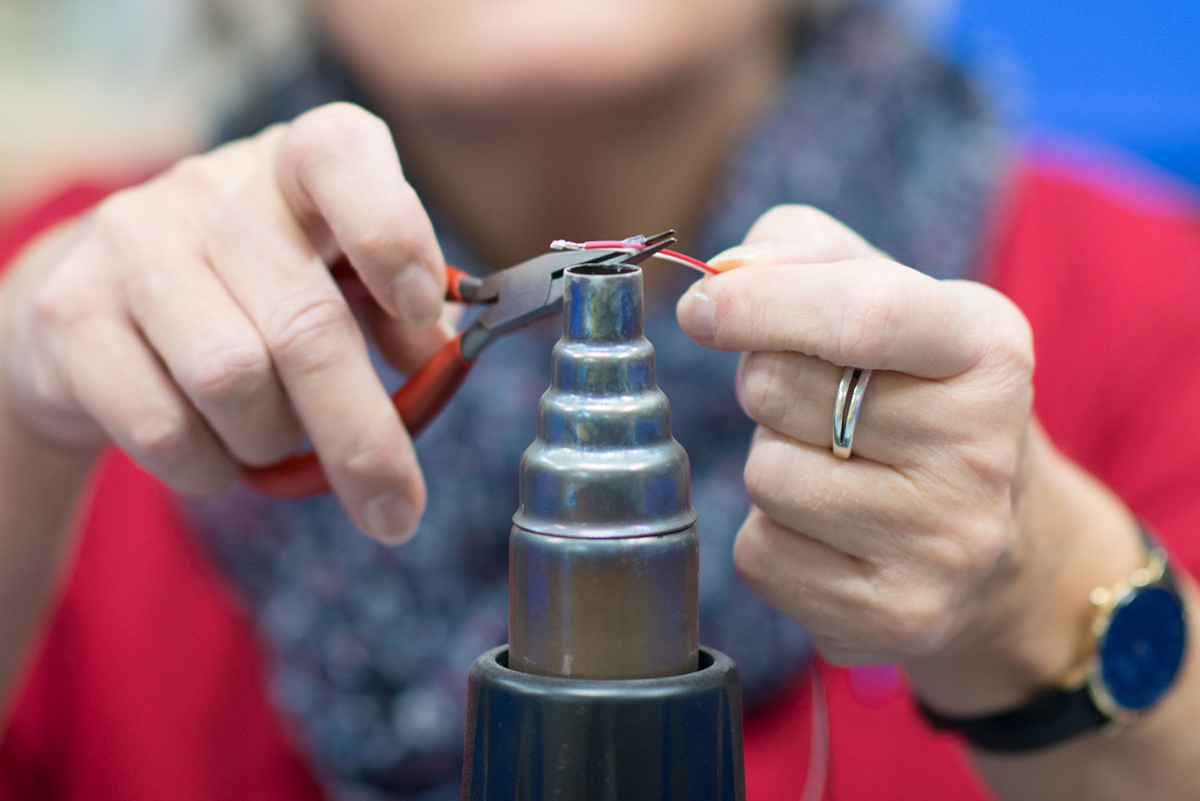
Pt100 table and matching probes direct from the manufacturer
Which resistance a sensor shows at which temperature is set out in the Pt100 table to DIN EN 60751. At 0 °C it reads exactly 100 ohms, which is where the name comes from. Platinum behaves as predictably across wide ranges as hardly any other material, which is why the Pt100 still sets the reference point in industrial temperature measurement.
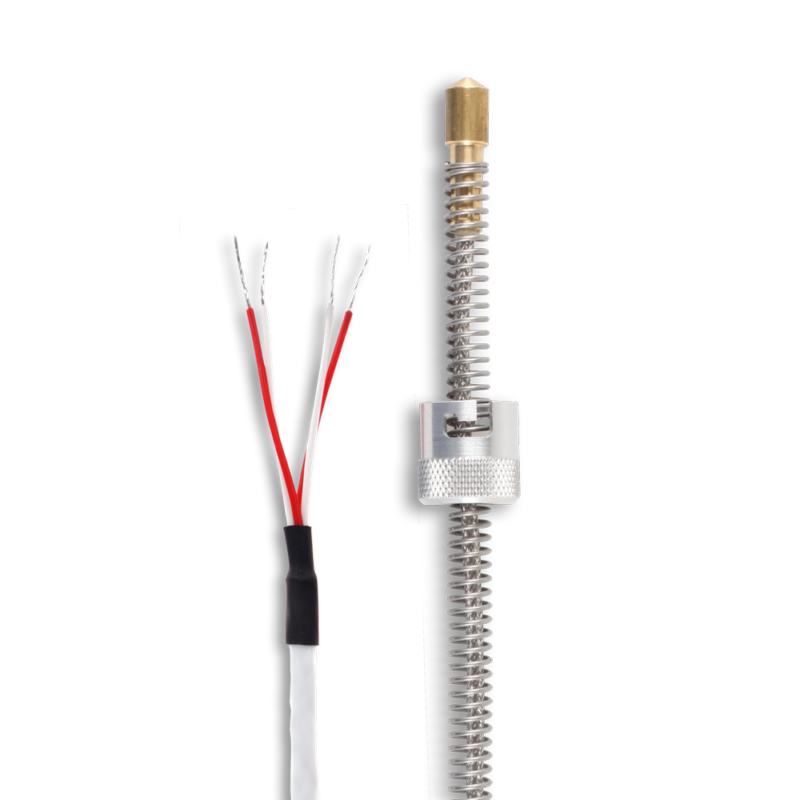
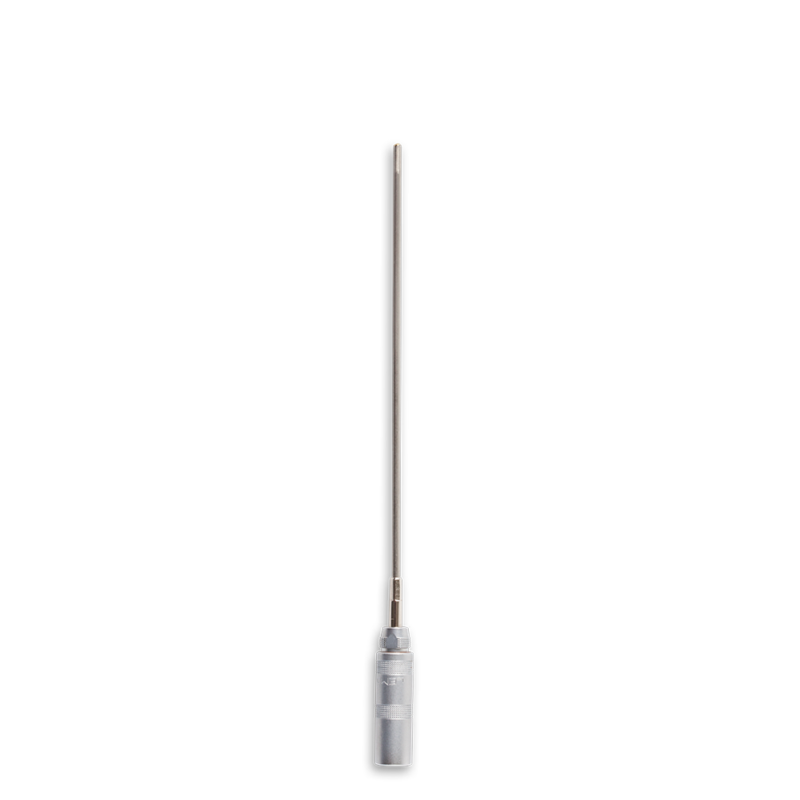
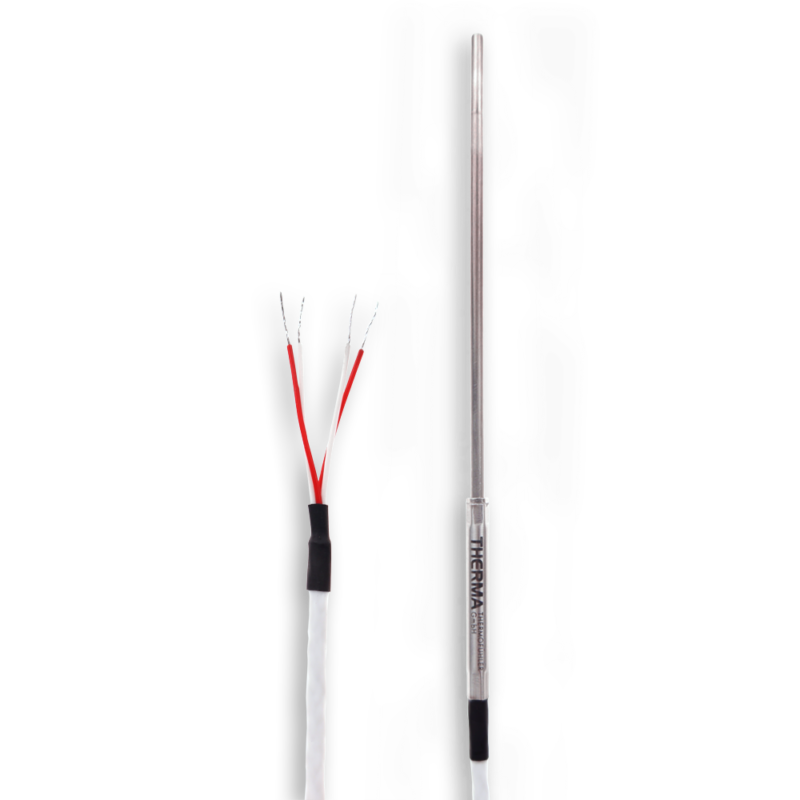
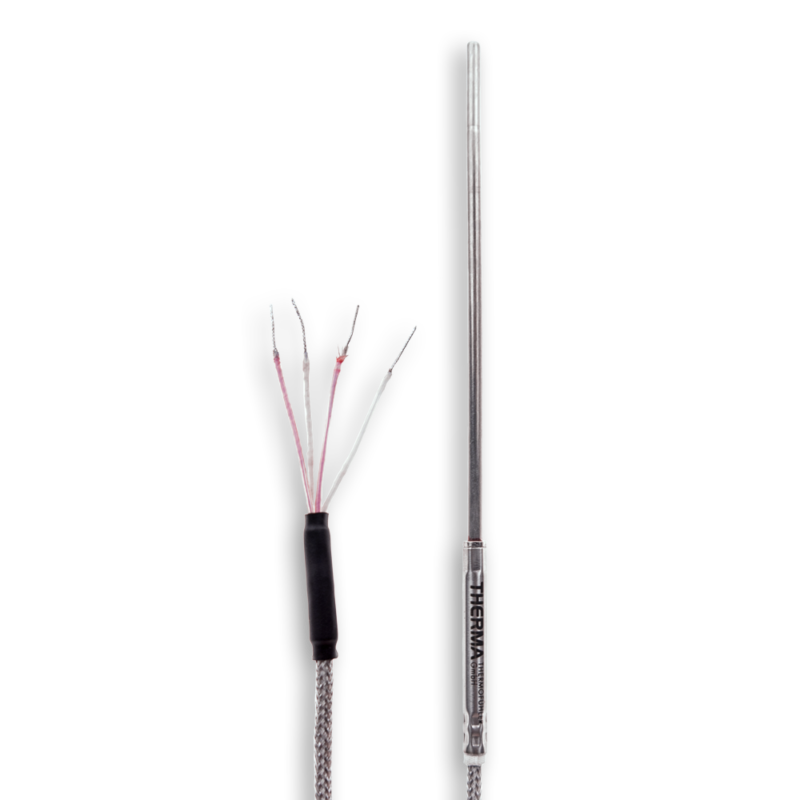
We have manufactured resistance thermometers in Lindlar since 1991, every sensor by hand and to ISO 9001. Our Pt100 temperature sensors come in all common designs, from the screw-in probe through the sheathed version to the spring-loaded surface sensor. Delivery usually takes one week, and a large part of the range sits in stock.
Custom designs to drawing or STEP file take one to two weeks. Nothing about the nominal values changes with them, because base resistance and temperature coefficient are standardised.
Whatever the sheath material, insertion length and process connection, the same Pt100 temperature sensor resistance table applies to every design. Differences from the Pt100 table arise solely from the tolerance class of the measuring resistor fitted.
Translating ohms into temperature with the Pt100 ohm table
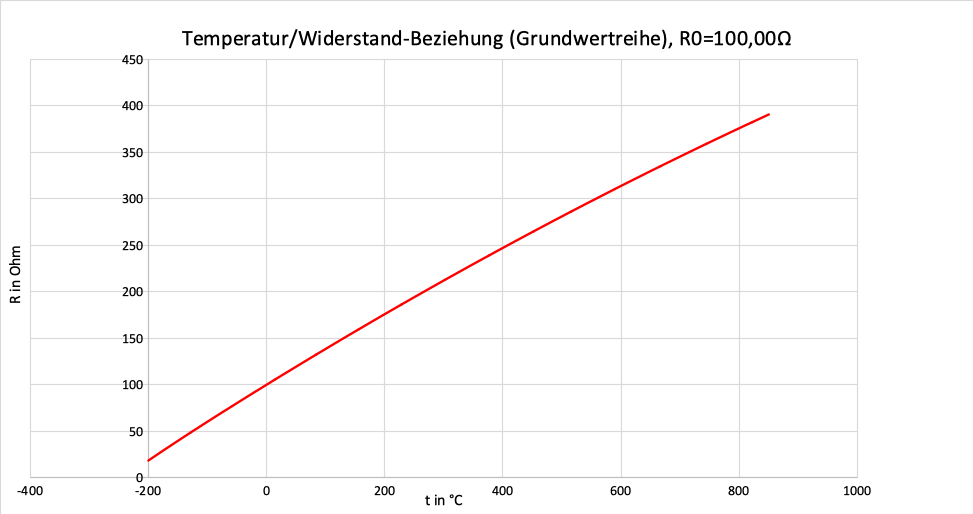
Measuring a resistance in the field leaves you needing the temperature behind it. The Pt100 table works in both directions, and reading the Pt100 ohm table backwards does exactly that. Close to 0 °C the value changes by around 0.39 ohms per kelvin, at 400 °C by only 0.345 ohms. No linear relationship follows from that, because the characteristic curve bends slightly. The Pt100 chart below covers the range in which most plants operate, extended by the permissible deviation of class A.
| Temperature | Resistance in ohms | Change per kelvin | Tolerance class A |
|---|---|---|---|
| minus 50 °C | 80.31 | 0.397 | ±0.25 K |
| 0 °C | 100.00 | 0.391 | ±0.15 K |
| 20 °C | 107.79 | 0.389 | ±0.19 K |
| 50 °C | 119.40 | 0.385 | ±0.25 K |
| 100 °C | 138.51 | 0.379 | ±0.35 K |
| 200 °C | 175.86 | 0.368 | ±0.55 K |
| 400 °C | 247.09 | 0.345 | ±0.95 K |
Two equal temperature steps show how strongly the curvature acts. From 0 to 100 °C the resistance rises by 38.51 ohms, from 300 to 400 °C by only 35.04 ohms. Values from other manufacturers match ours, since a Pt100 RTD resistance chart follows the same standard.
At 20 °C a Pt100 reads 107.79 ohms, less than a straight line predicts. Our complete Pt100 resistance table maps the progression from minus 200 to 850 °C in 1 kelvin steps. Between two neighbouring rows, linear interpolation is enough and the remaining curvature error is negligible. For intermediate values or the back-calculation from ohms to temperature, use our Pt100 calculator.
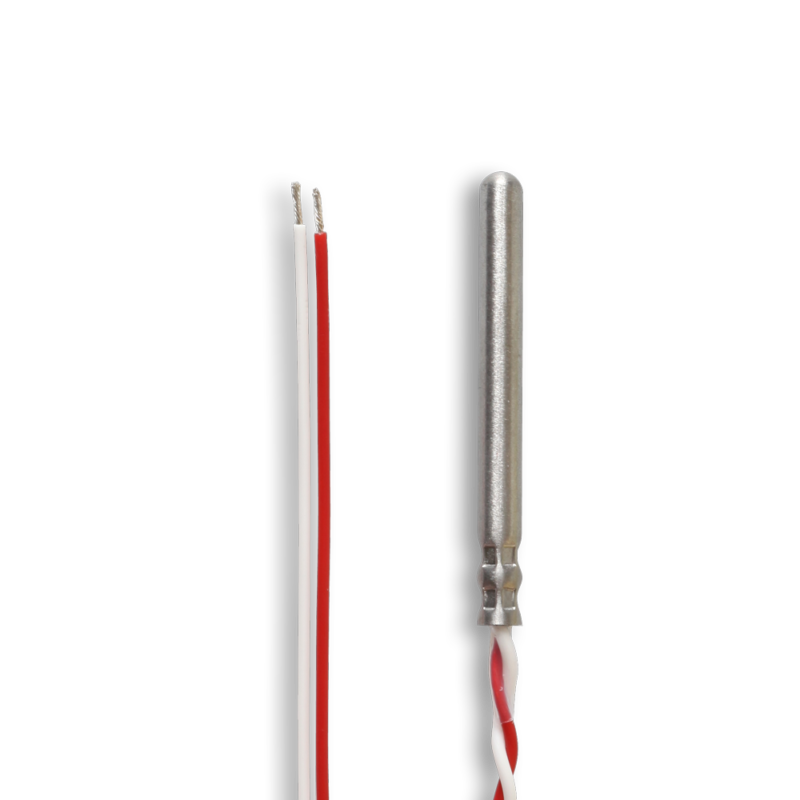
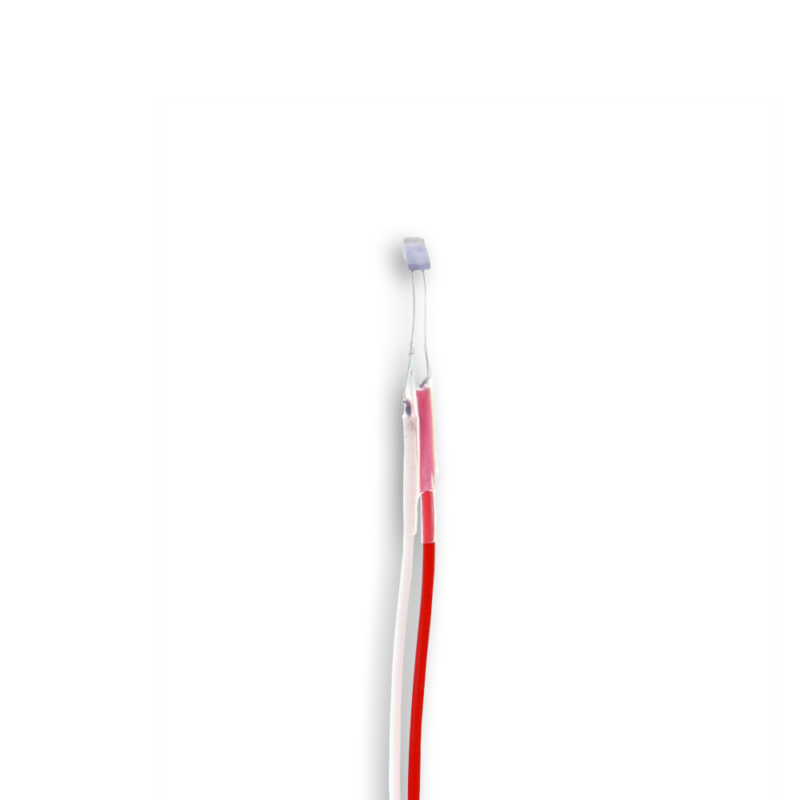

Temperature/resistance relationship table PT 100 & 1000
| t [°C] | R0=100 [Ω] | R0=1000 [Ω] |
| -200 | 18,5 | 185,2 |
| -150 | 39,7 | 397,2 |
| -100 | 60,3 | 602,6 |
| -50 | 80,3 | 803,1 |
| 0 | 100,0 | 1000,0 |
| 100 | 138,5 | 1385,1 |
| 200 | 175,9 | 1758,6 |
| 300 | 212,1 | 2120,5 |
| 400 | 247,1 | 2470,9 |
| 500 | 281,0 | 2809,8 |
| 600 | 313,7 | 3137,1 |
| 700 | 345,3 | 3452,8 |
| 800 | 375,7 | 3757,0 |
| 850 | 390,5 | 3904,8 |
| t [°C] | R0=100 [Ω] | R0=1000 [Ω] |
| -200 | 18,5 | 185,2 |
| -190 | 22,8 | 228,3 |
| -180 | 27,1 | 271,0 |
| -170 | 31,3 | 313,4 |
| -160 | 35,5 | 355,4 |
| -150 | 39,7 | 397,2 |
| -140 | 43,9 | 438,8 |
| -130 | 48,0 | 480,0 |
| -120 | 52,1 | 521,1 |
| -110 | 56,2 | 561,9 |
| -100 | 60,3 | 602,6 |
| -90 | 64,3 | 643,0 |
| -80 | 68,3 | 683,3 |
| -70 | 72,3 | 723,3 |
| -60 | 76,3 | 763,3 |
| -50 | 80,3 | 803,1 |
| -40 | 84,3 | 842,7 |
| -30 | 88,2 | 882,2 |
| -20 | 92,2 | 921,6 |
| -10 | 96,1 | 960,9 |
| 0 | 100,0 | 1000,0 |
| 10 | 103,9 | 1039,0 |
| 20 | 107,8 | 1077,9 |
| 30 | 111,7 | 1116,7 |
| 40 | 115,5 | 1155,4 |
| 50 | 119,4 | 1194,0 |
| 60 | 123,2 | 1232,4 |
| 70 | 127,1 | 1270,8 |
| 80 | 130,9 | 1309,0 |
| 90 | 134,7 | 1347,1 |
| 100 | 138,5 | 1385,1 |
| 110 | 142,3 | 1422,9 |
| 120 | 146,1 | 1460,7 |
| 130 | 149,8 | 1498,3 |
| 140 | 153,6 | 1535,8 |
| 150 | 157,3 | 1573,3 |
| 160 | 161,1 | 1610,5 |
| 170 | 164,8 | 1647,7 |
| 180 | 168,5 | 1684,8 |
| 190 | 172,2 | 1721,7 |
| 200 | 175,9 | 1758,6 |
| 210 | 179,5 | 1795,3 |
| 220 | 183,2 | 1831,9 |
| 230 | 186,8 | 1868,4 |
| 240 | 190,5 | 1904,7 |
| 250 | 194,1 | 1941,0 |
| 260 | 197,7 | 1977,1 |
| 270 | 201,3 | 2013,1 |
| 280 | 204,9 | 2049,0 |
| 290 | 208,5 | 2084,8 |
| 300 | 212,1 | 2120,5 |
| 310 | 215,6 | 2156,1 |
| 320 | 219,2 | 2191,5 |
| 330 | 222,7 | 2226,8 |
| 340 | 226,2 | 2262,1 |
| 350 | 229,7 | 2297,2 |
| 360 | 233,2 | 2332,1 |
| 370 | 236,7 | 2367,0 |
| 380 | 240,2 | 2401,8 |
| 390 | 243,6 | 2436,4 |
| 400 | 247,1 | 2470,9 |
| 410 | 250,5 | 2505,3 |
| 420 | 254,0 | 2539,6 |
| 430 | 257,4 | 2573,8 |
| 440 | 260,8 | 2607,8 |
| 450 | 264,2 | 2641,8 |
| 460 | 267,6 | 2675,6 |
| 470 | 270,9 | 2709,3 |
| 480 | 274,3 | 2742,9 |
| 490 | 277,6 | 2776,4 |
| 500 | 281,0 | 2809,8 |
| 510 | 284,3 | 2843,0 |
| 520 | 287,6 | 2876,2 |
| 530 | 290,9 | 2909,2 |
| 540 | 294,2 | 2942,1 |
| 550 | 297,5 | 2974,9 |
| 560 | 300,8 | 3007,5 |
| 570 | 304,0 | 3040,1 |
| 580 | 307,3 | 3072,5 |
| 590 | 310,5 | 3104,9 |
| 600 | 313,7 | 3137,1 |
| 610 | 316,9 | 3169,2 |
| 620 | 320,1 | 3201,2 |
| 630 | 323,3 | 3233,0 |
| 640 | 326,5 | 3264,8 |
| 650 | 329,6 | 3296,4 |
| 660 | 332,8 | 3327,9 |
| 670 | 335,9 | 3359,3 |
| 680 | 339,1 | 3390,6 |
| 690 | 342,2 | 3421,8 |
| 700 | 345,3 | 3452,8 |
| 710 | 348,4 | 3483,8 |
| 720 | 351,5 | 3514,6 |
| 730 | 354,5 | 3545,3 |
| 740 | 357,6 | 3575,9 |
| 750 | 360,6 | 3606,4 |
| 760 | 363,7 | 3636,7 |
| 770 | 366,7 | 3667,0 |
| 780 | 369,7 | 3697,1 |
| 790 | 372,7 | 3727,1 |
| 800 | 375,7 | 3757,0 |
| 810 | 378,7 | 3786,8 |
| 820 | 381,7 | 3816,5 |
| 830 | 384,6 | 3846,0 |
| 840 | 387,6 | 3875,5 |
| 850 | 390,5 | 3904,8 |

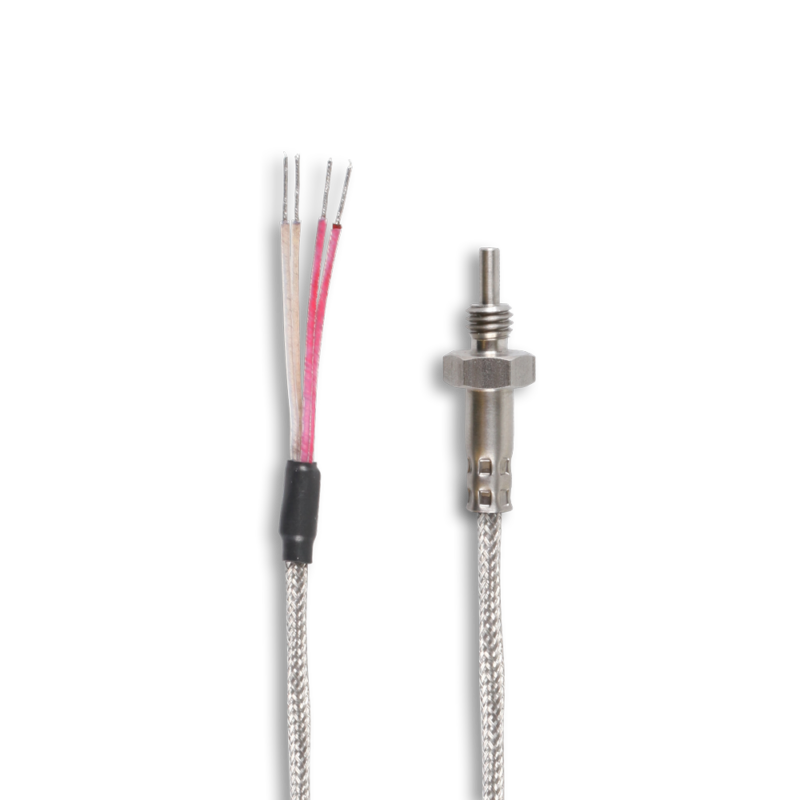
Cable lug RTD | Teflon | Pt100
21,86 € 
Sheathing | without wire | Pt100
59,40 € Sheathing | Fibreglass | Pt100
67,25 € Sheathing tube | Teflon | Pt100
21,10 € 
Other resistance thermometers
Lead resistance distorts the value you read
Because every supply line brings resistance of its own, a transmitter cannot separate that share from the sensor value. At a base resistance of only 100 ohms, this error carries real weight, since the Pt100 table describes the platinum element alone. A 30 m connecting cable with 0.34 mm² cross-section contributes around 3.1 ohms across the outgoing and return conductor, which pushes the reading up by roughly 8 K.
Compensation comes from the circuit type. A 3 wire circuit calculates the share out, the 4 wire circuit removes it entirely. Which version your measuring chain needs depends on cable length, cross-section and the accuracy you require, and all selection criteria are collected on our page about Pt100 wiring. The measuring current has an effect too, because it warms the platinum element slightly. Even so, the usual 1 mA amounts to a few tenths of a kelvin in still air and stays below the detection limit in moving water. With implausible readings, check terminals and wiring first, before you replace the probe. A comparison against the Pt100 resistance chart usually narrows the cause down within minutes. In that check, the Pt100 table stays the fixed reference. The sensor itself is rarely to blame.
Which tolerance class to DIN EN 60751 do you really need?
Every row of the Pt100 temperature resistance table names a nominal value that a real probe reaches within its tolerance class. What decides is not the class alone, but its range of validity. Nothing in the Pt100 table changes with the class, only the permitted spread around each value. Class A covers minus 100 to 450 °C on wire-wound elements, on thin-film elements only minus 30 to 300 °C. Class AA draws the limits tighter, yet applies wire-wound from minus 50 to 250 °C only. Above that, class B remains and reaches to 600 °C.
Is class B enough for your application? At 200 °C it allows a deviation of 1.3 K, class A at the same point only 0.55 K. A class B measurement therefore scatters more than twice as far, which quickly tips the balance in control loops with a narrow setpoint band.
Whether a probe actually holds its class only becomes clear through calibration against traceable standards. In our own works we test between minus 30 and 650 °C, accredited to DIN EN ISO/IEC 17025 on request. The certificate records the real deviation at each test point and extends the Pt100 temperature table with your own readings.
The Pt100 resistance table PDF fits into any test equipment file
Test equipment management needs the Pt100 table offline. Print the Pt100 resistance table PDF, file it and add it to the device documentation. All reference points are held in 1 kelvin steps, together with the limit deviation of classes A and B. No registration is needed for the download. Service technicians usually carry the Pt100 temperature chart with them in printed form.
In purchasing databases the file often appears as an RTD Pt100 resistance table PDF, which is the same document filed under a different name. Buyers in North America look for the figures under 100 Ohm platinum RTD chart. Another common name over there is the 100 Ohm RTD table, and the values behind both are identical.
Those numbers are also ready as a Pt100 table Excel file, extended by empty columns for your actual readings. Recurring tests are documented without manual retyping. In a spreadsheet, the deviation is calculated for you as you go.
Looking for the right sensor for your measuring task? Our category resistance thermometers is the place to start. For special designs, tighter tolerance classes or the right connection version, our team in Lindlar helps by phone and by email. You speak directly to the colleagues who then build your probe.
